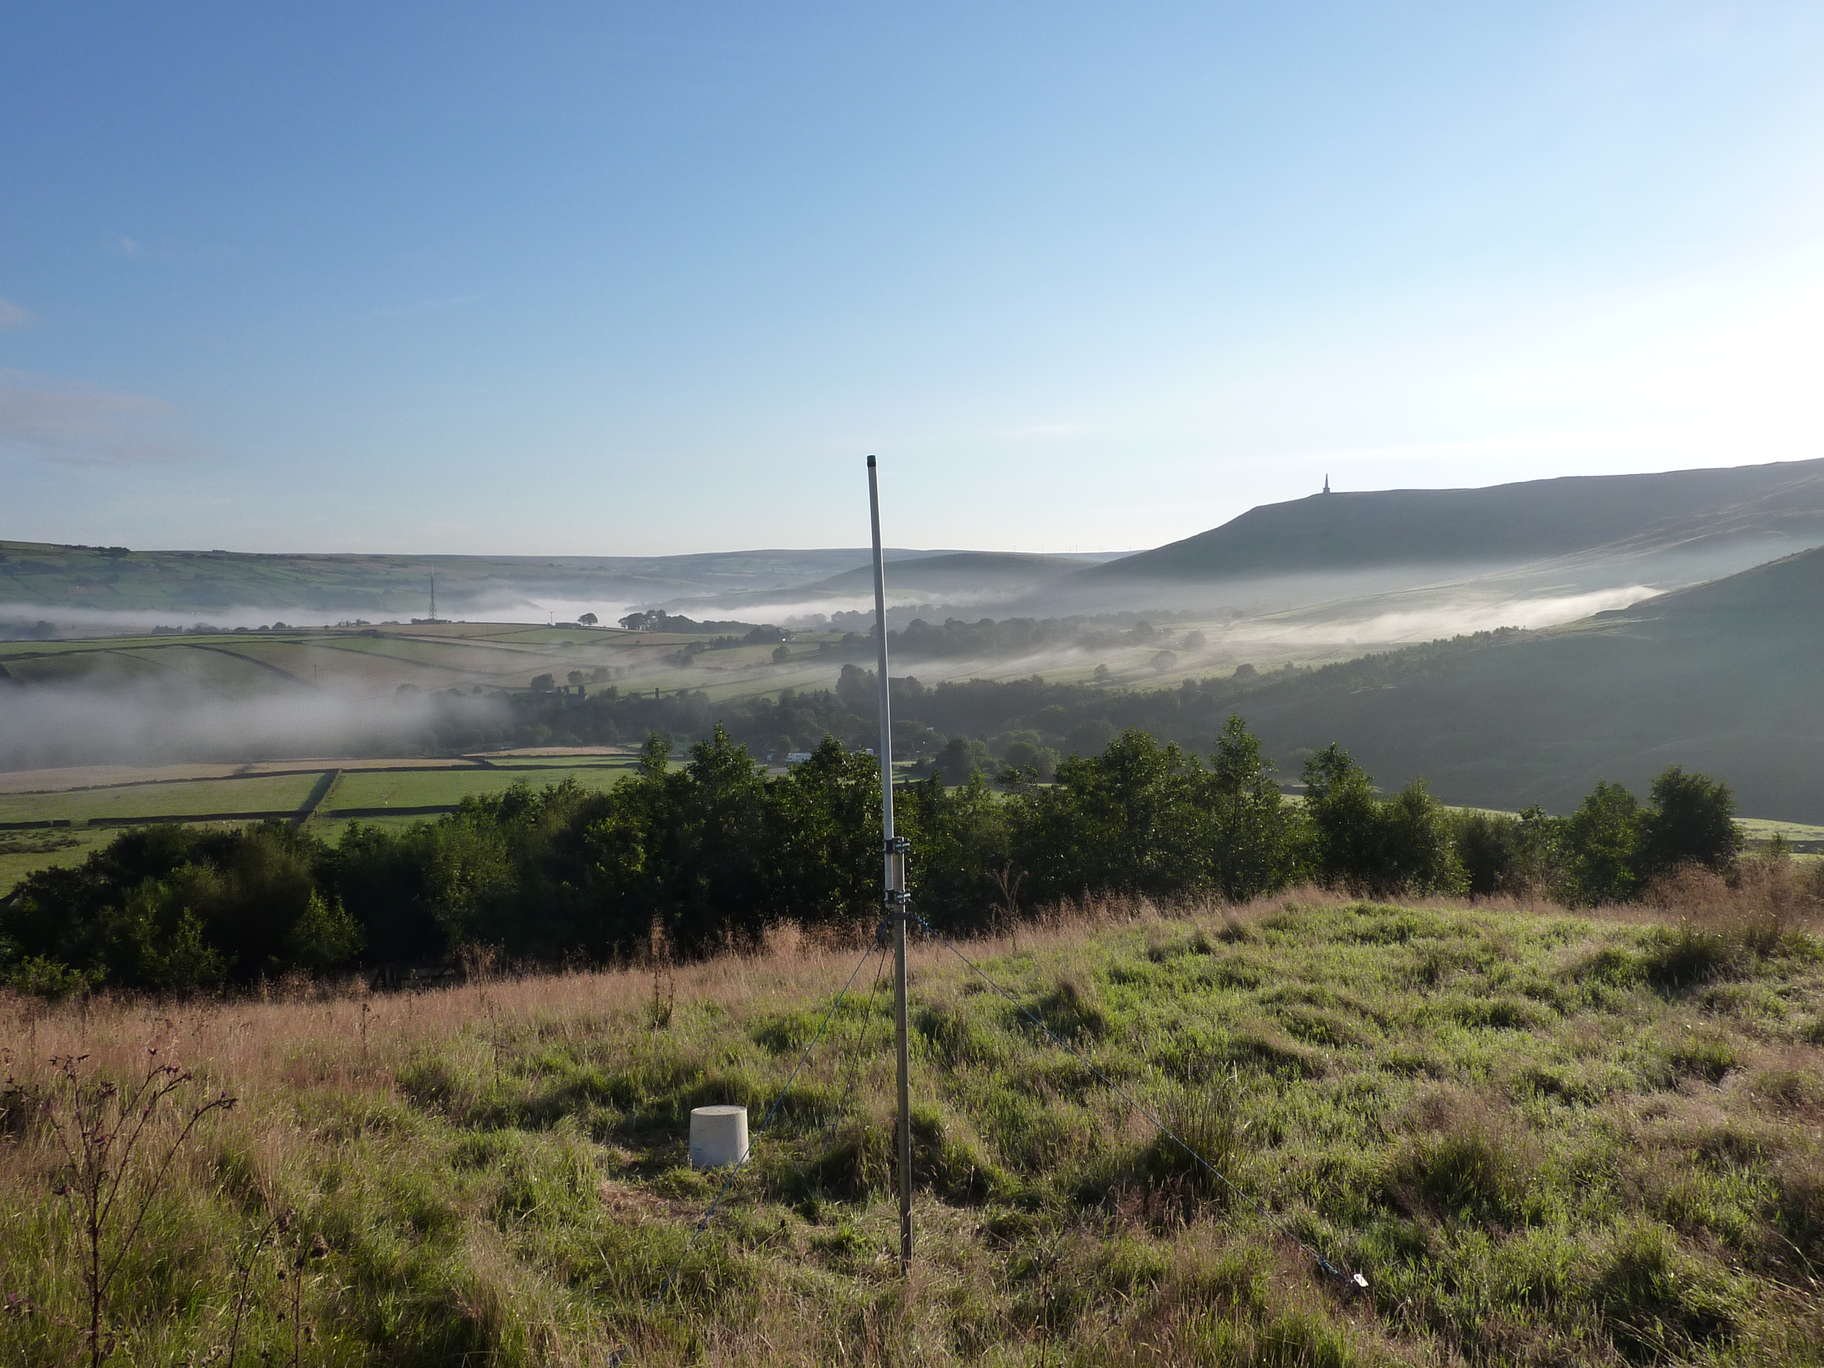
Todmorden VLF was a 3-axis general purpose VLF receiver located at 53.703N,2.072W in the small village of Lumbutts on the edge of the moors about 5km south-east of the town of Todmorden in the Pennines. The receiver ran from 2005 to June 2024, with several upgrades of the electronics and software along the way.
The receiver ran continuously, capturing natural radio events and amateur radio activity through a pair of orthogonal magnetic loops and a vertical electric field probe.
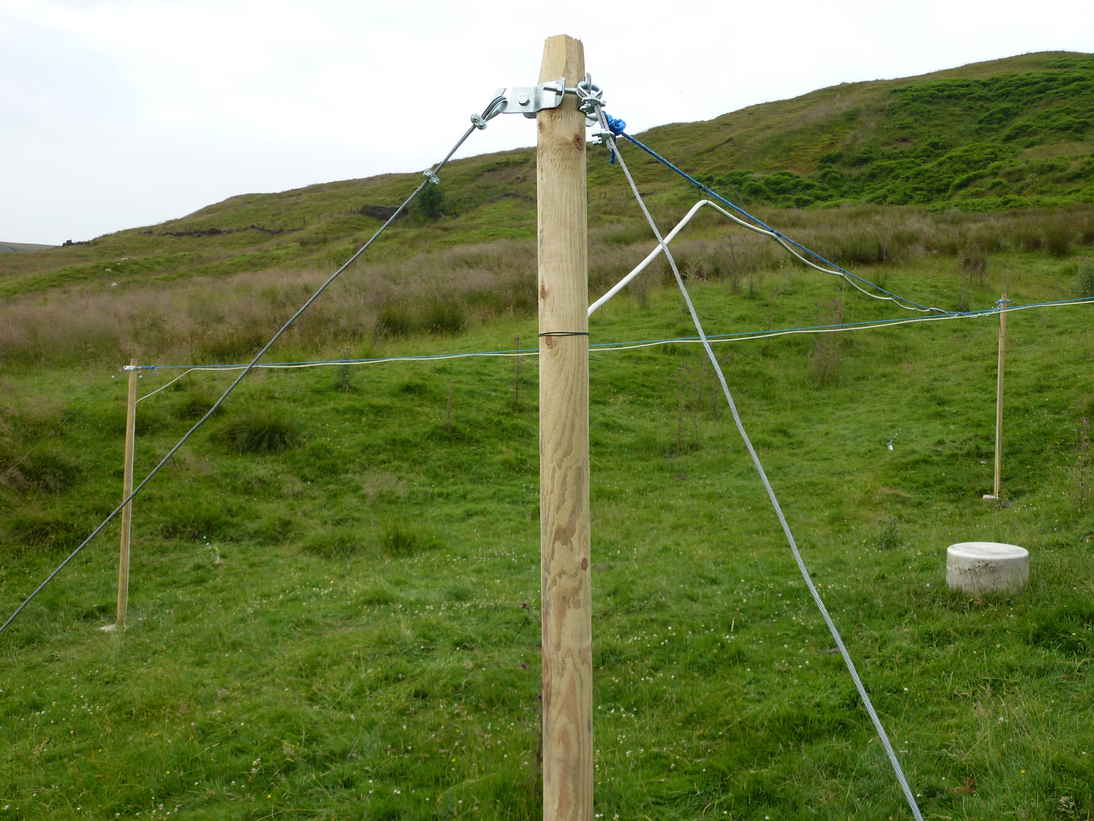
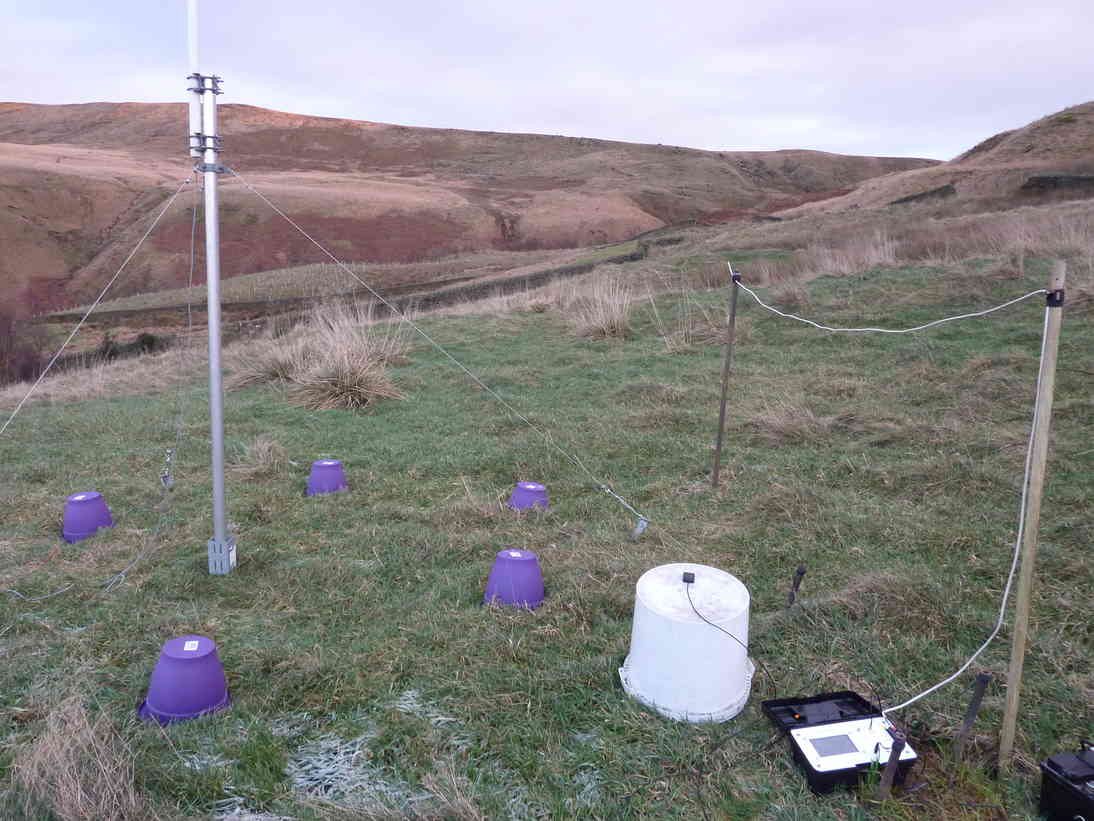
The two receivers (electric field and magnetic field) were separately located in open fields bordering the moorland, about 200m apart and at least 150m from the nearest buildings or power lines. Power was supplied at DC by isolated regulating switching converters (at both ends of the feeder cable) and signal downlink was isolated by audio transformers (also at both ends) with connections made through buried armoured CAT5 Ethernet cable.
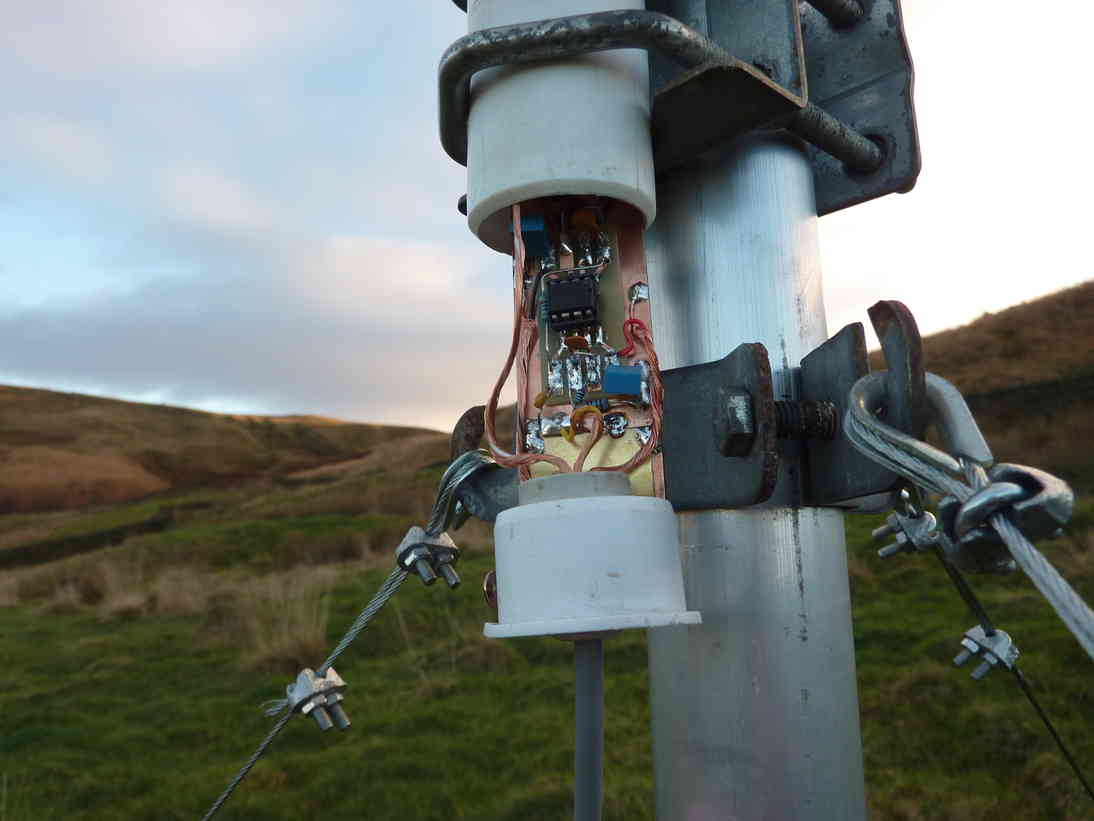
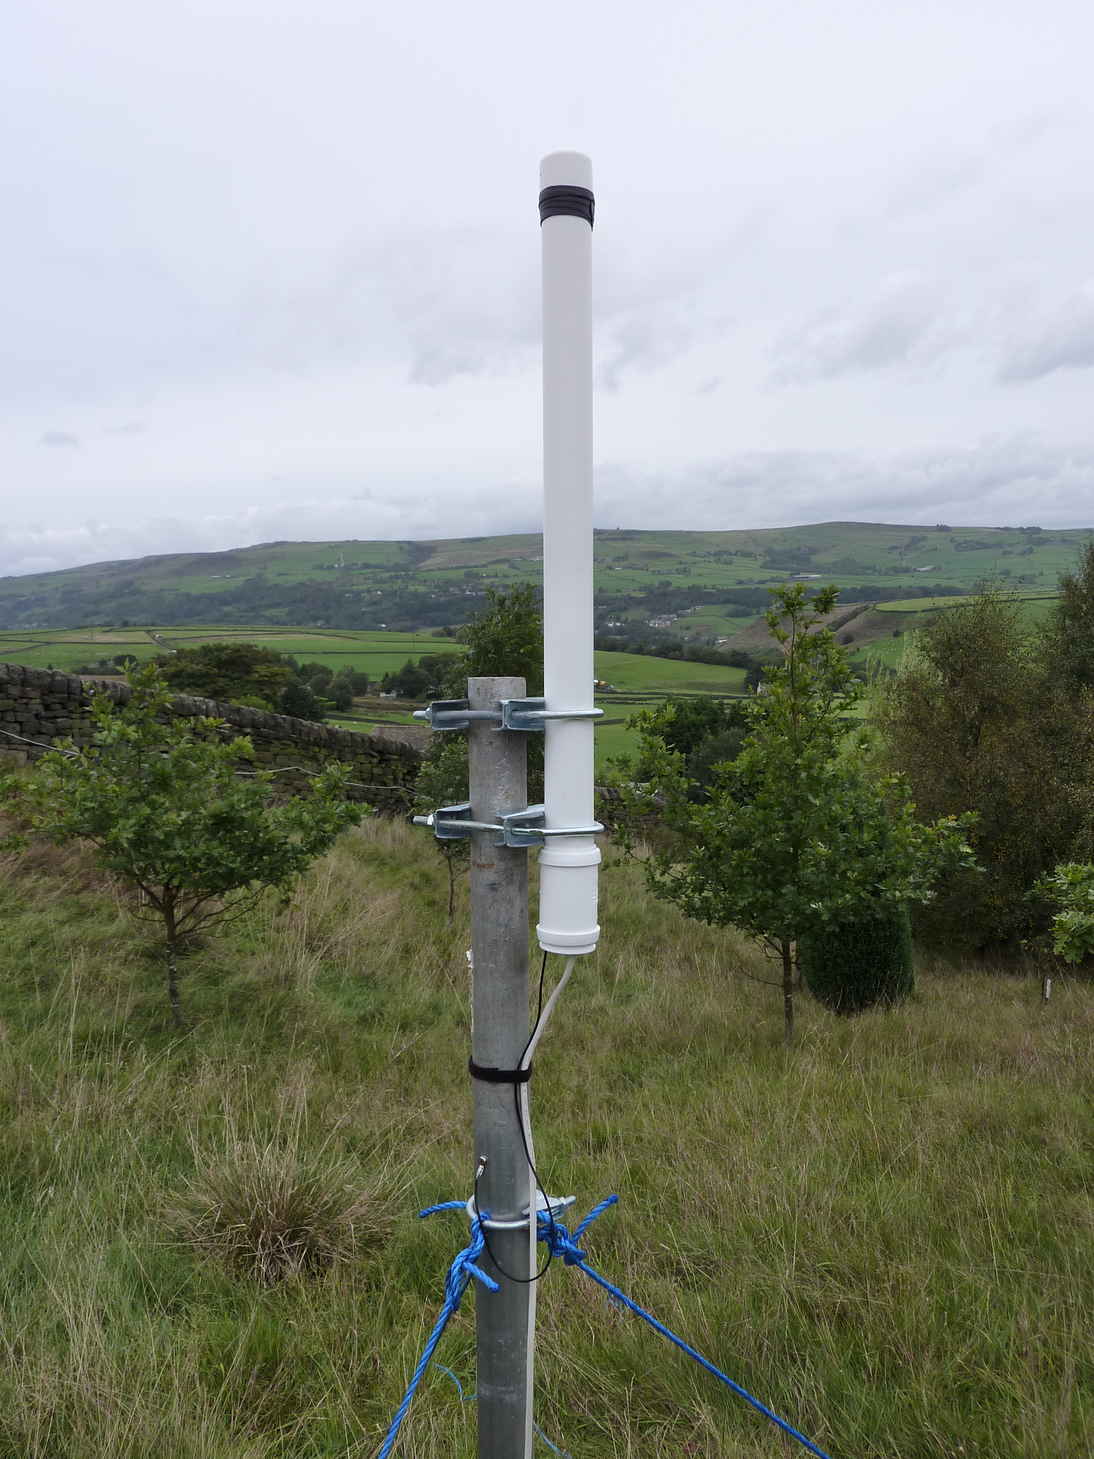
Antenna: Vertical tube 2m x 40mm, fixed on top of a 2m guyed metal pole. Effective height 1.65m, 170813a.jpg;
Pre-amp: AD823, circuit: prx-e1-1.pdf;
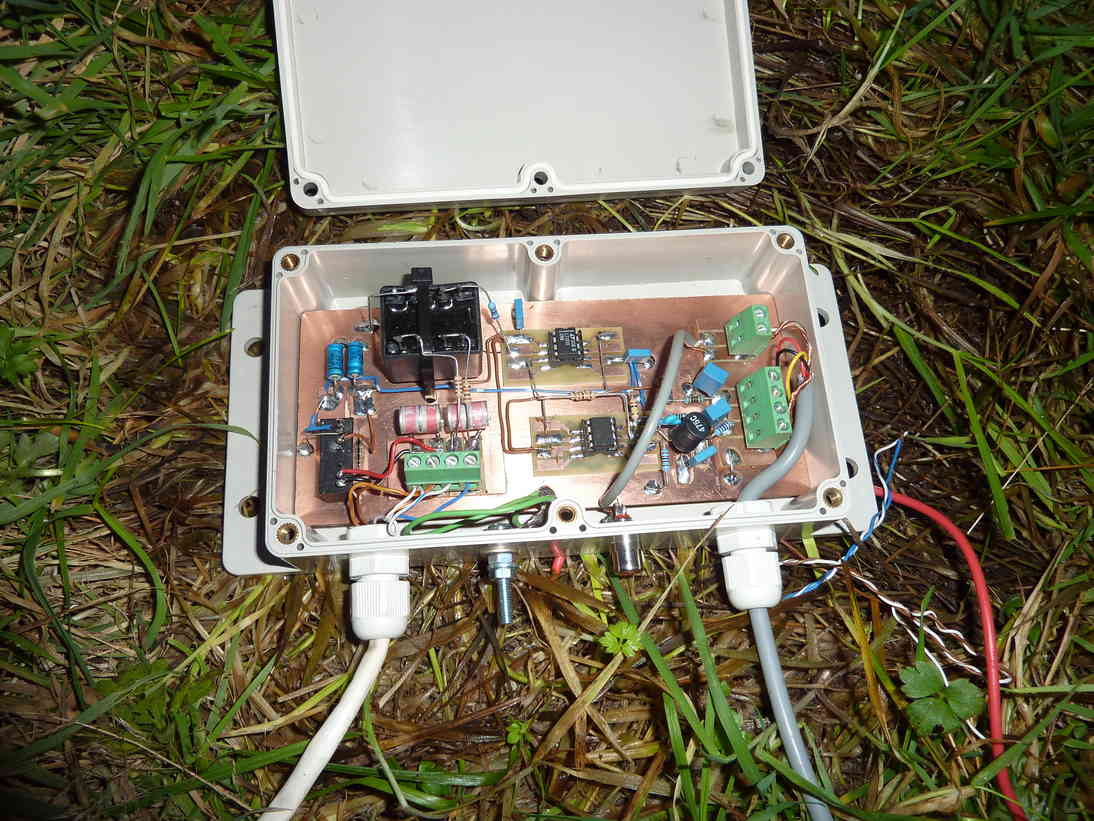
Line driver: LT1010, circuit: prx-t1-1.pdf;
System noise density: 40nV/m/root(Hz) at 8kHz;
Construction: Manhattan;
Antenna and pre-amp photos:
171129d.jpg,
171129a.jpg;
Line driver and power supply photos:
171129c.jpg;
The pre-amp was located inside the base of the antenna tube. The line driver and power supply were in a separate box installed several metres away and connected via multi-score screened cable. The power supply receives 48V DC via a cat-5 pair, this was converted to an isolated, filtered and regulated +/- 15V for the pre-amp and line driver.
Antenna: Each loop rectangular 20 m^2, 3 turns of heavy duty mains cable, 1.4 ohms, 375uH;
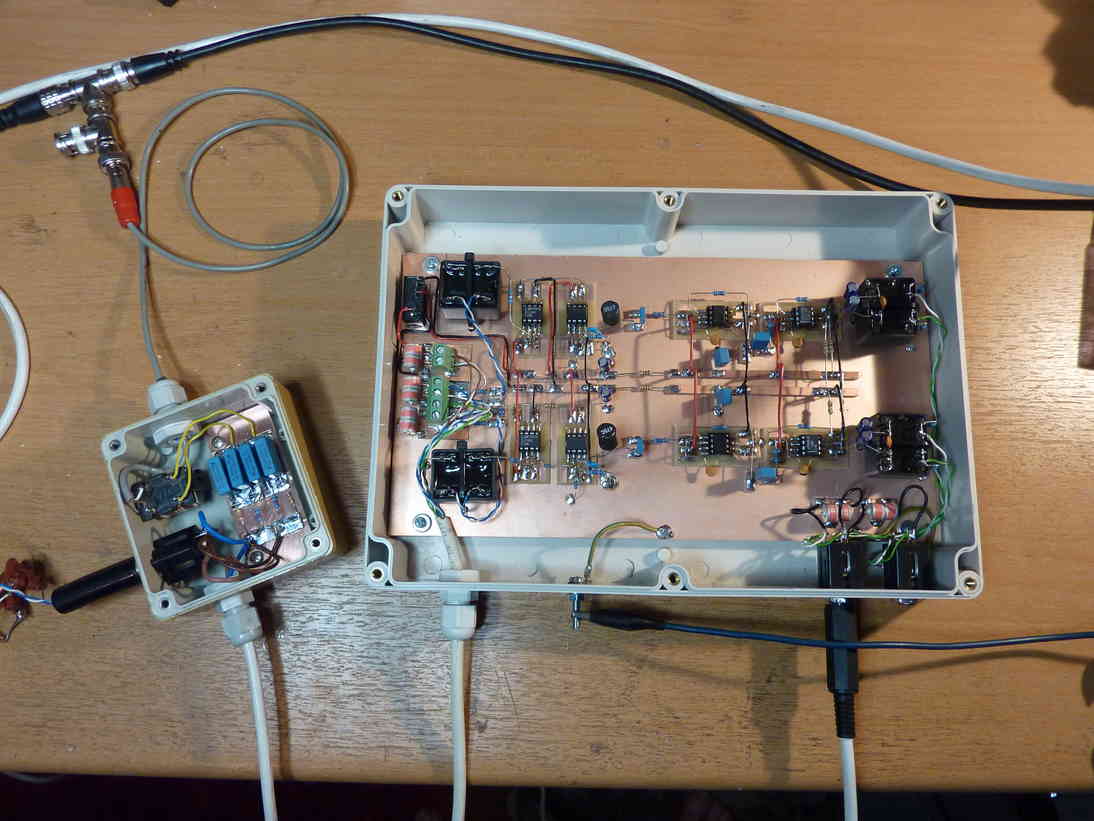
Pre-amp: LT1028, circuit (per channel): prx-h1-sim1.pdf;
Line driver: LT1010, circuit (per channel): prx-t1-1.pdf;
System noise density: 0.15fT/root(Hz) at 8kHz;
Construction: Manhattan;
Antenna photos: 1010111.jpg;
Pre-amp, line driver, power supply: 1020280.jpg;
The power supply receives 48V DC via a cat-5 pair, this was converted to an isolated, filtered and regulated +/- 15V for the pre-amp and line driver.
The receivers were located at separate sites, about 150 metres (E-field) and 250 metres (H-field) from the house. Cat-5 ethernet cable carries 48V DC and the VLF downlink to/from each site. The VLF pairs were transformer isolated at both ends of the cable. The DC pairs were isolated at both ends via XPpower IP series devices.
The three VLF channels went through isolating transformers into three inputs of a four channel Behringer UMC404HD audio interface. The fourth input was supplied with a 10uS 1PPS from a u-blox 7M GPS module.
All of the signal processing uses vlfrx-tools running on Linux PCs.
The UMC404HD was read by
vtcard which was sampling at 192k frames/second and gives the data an approximate timestamp derived from the system clock.
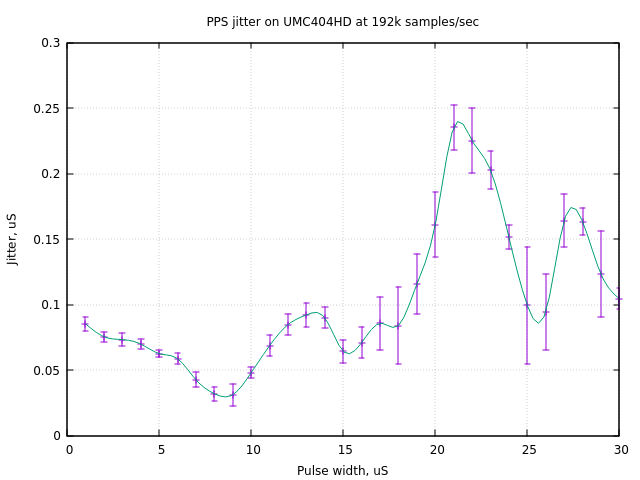
The program vttime refines the timestamp using the PPS signal in channel 4, to an accuracy of around 50nS.
From there, the signal was resampled to various sample rates and sent into further processing pipelines:
Both receivers were calibrated for group delay, phase, and amplitude response using a GPS-based signal generator. Group delay calibration was applied via the c=offset vttime option, while amplitude and phase calibration was applied in the form of equalisation maps via vtfilter. After calibration was applied, one sound card unit corresponds to 0.299V/m field strength or 1000pT flux density. This allows the three channels to be mixed to synthesise various polarisations and beam azimuths. The calibration was good enough to achieve about 30dB front/back ratio on a synthesized cardioid.
Audio 150224a.mp3;
Audio 160317a.mp3;
Audio 161029a.mp3;
Audio au170515a.mp3;
Audio 160307c.mp3;
Polar spectrogram video wh180123b.avi;
Polar spectrogram video wh210326a.avi;
Polar spectrogram video aw110206a.avi (with triggered emissions);
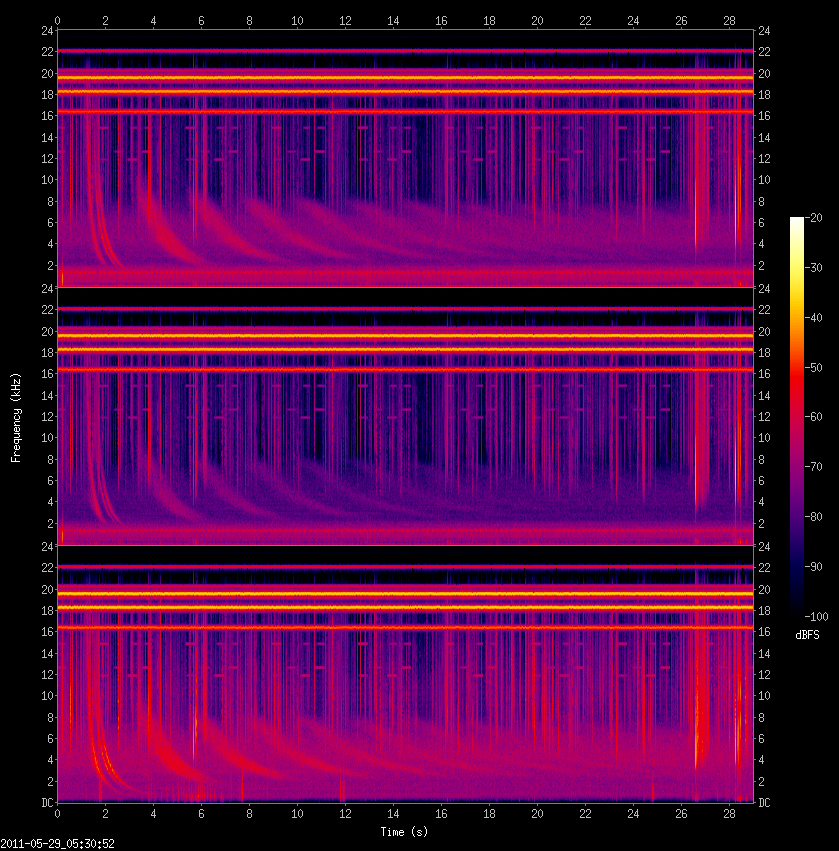
Spectrogram, echo train, LH circular, RH circular, Vertical E-field wh110529a.png;
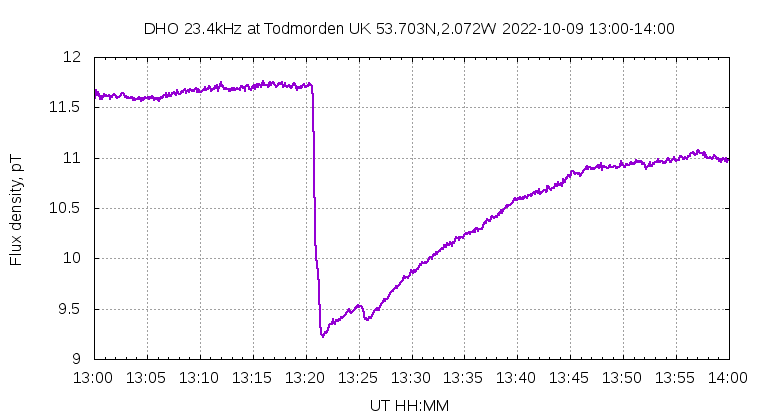
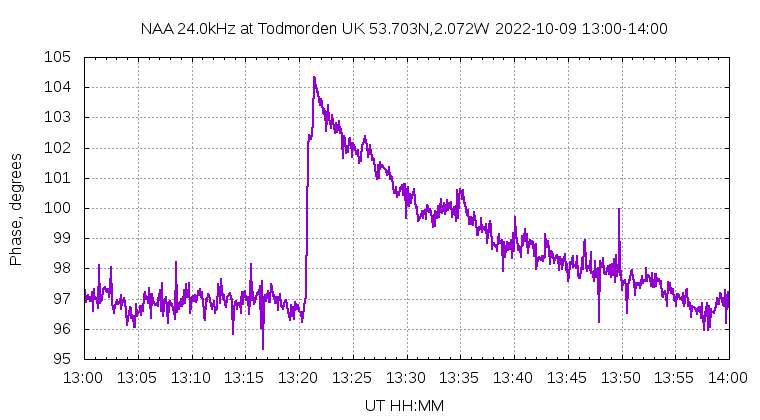
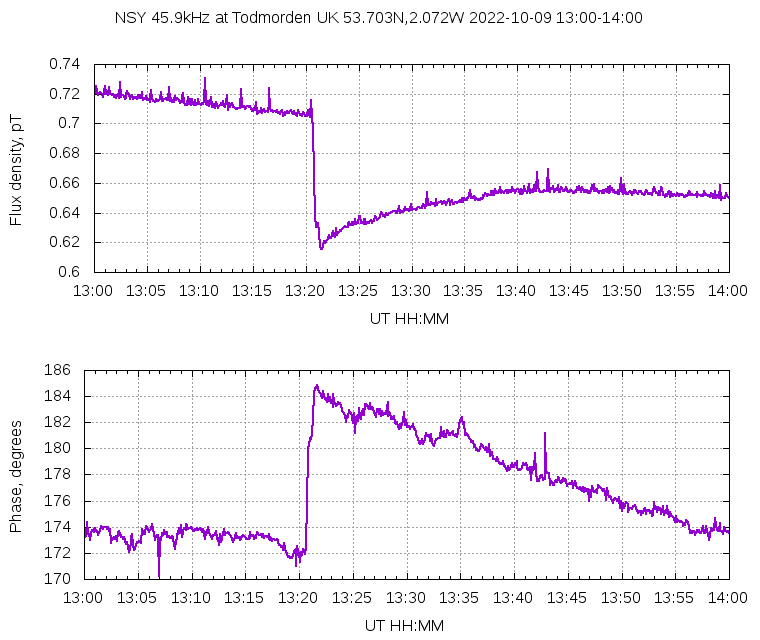
Effect of gamma ray burst GRB221009A on DHO
grb221009a-DHO.png,
on NAA grb221009a-NAA.png,
on NSY grb221009a-NSY.png;
Audio saq211224.mp3;
Spectrogram, EIC mode cutoffs 150822_sferic_modes_EW_25a.png;
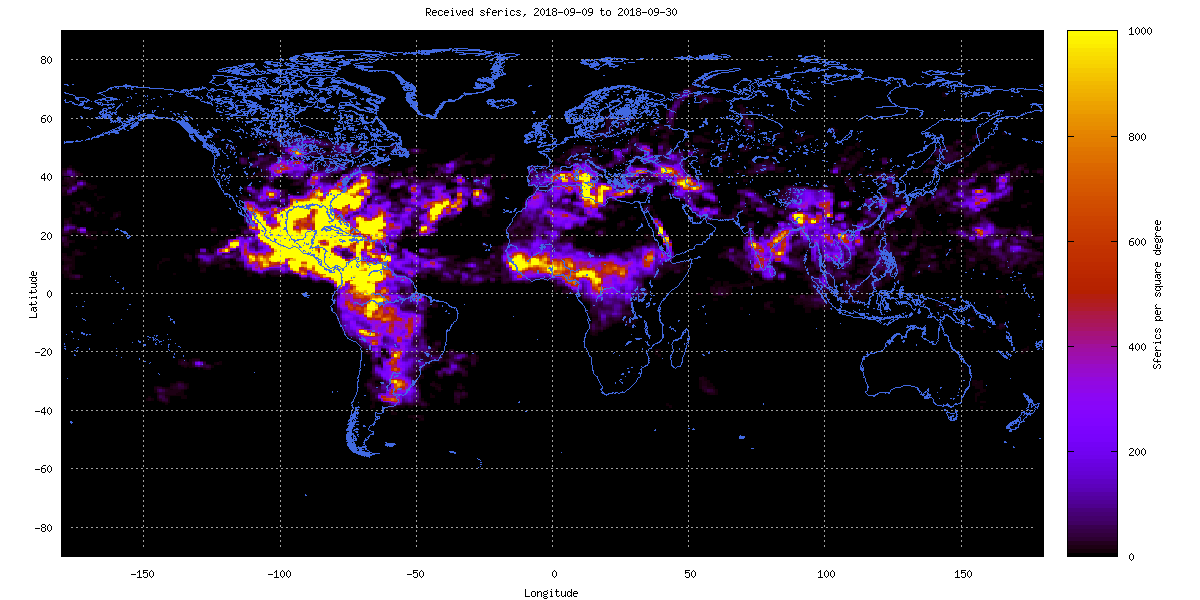
World map, locations of sferics over 20 days pn181029a.png;
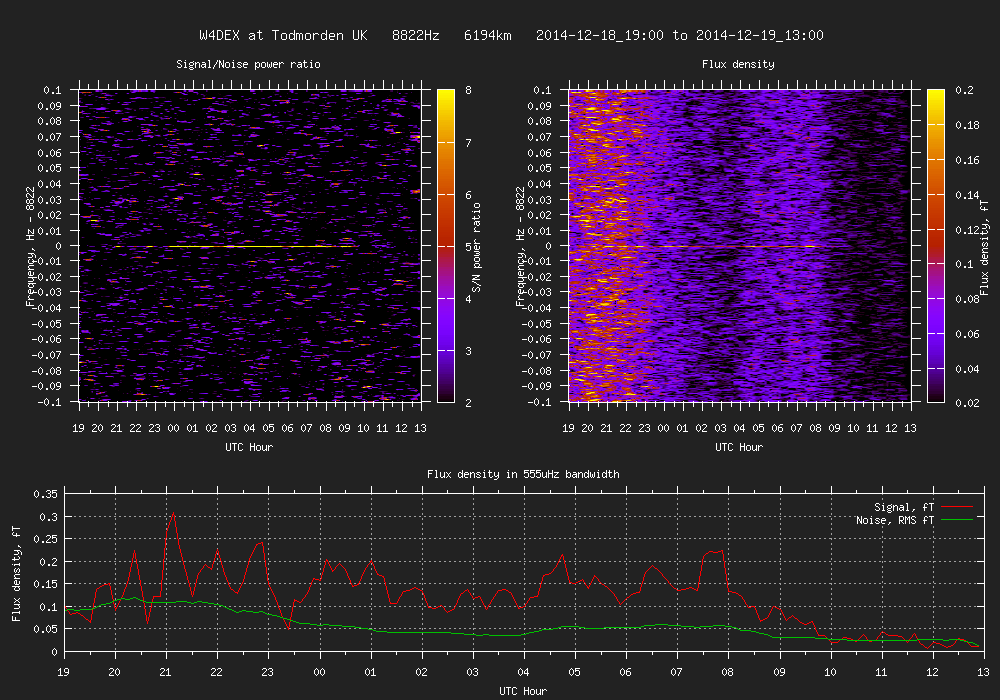
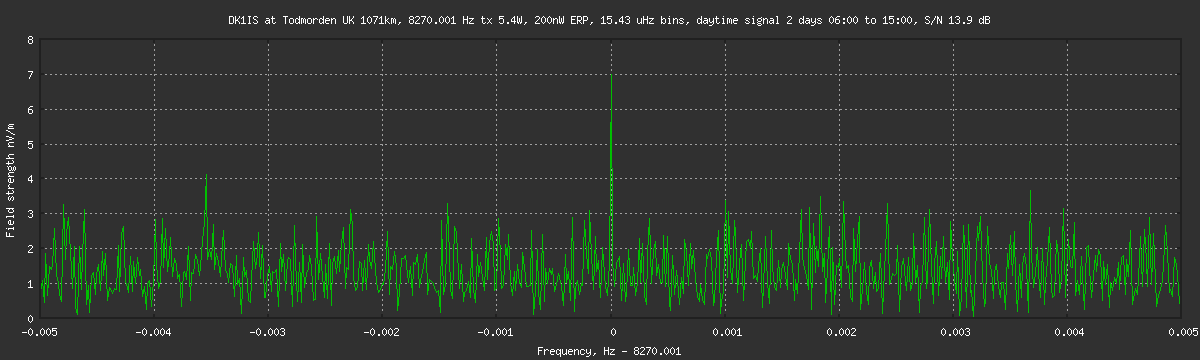
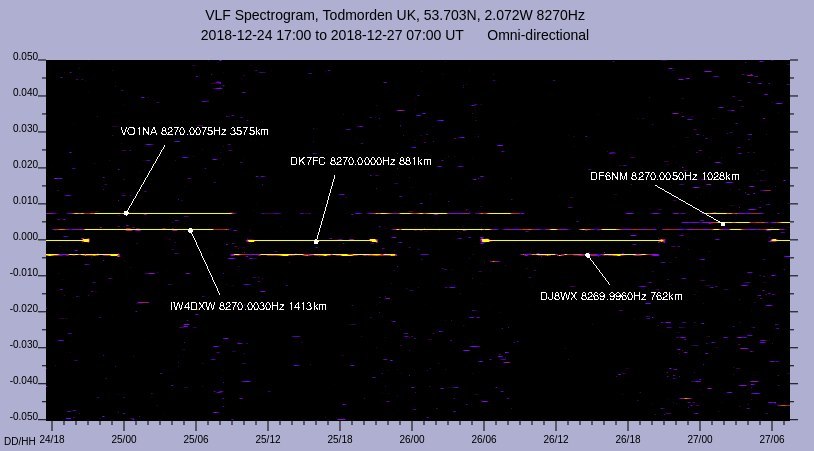
These were well below noise in any audible bandwidth, but can be seen on narrow band spectrum and spectrogram plots.
Spectrogram. W4DEX (6194km) 141219c.png;
Spectrum. DK1IS 1071km 200nW ERP 200126f.png;
Spectrum. F5VLB 577km 5W transmit, 80nW ERP 220209a.png;
Spectrogram, five amateur signals active in 8270 Hz band 181227a.jpg;
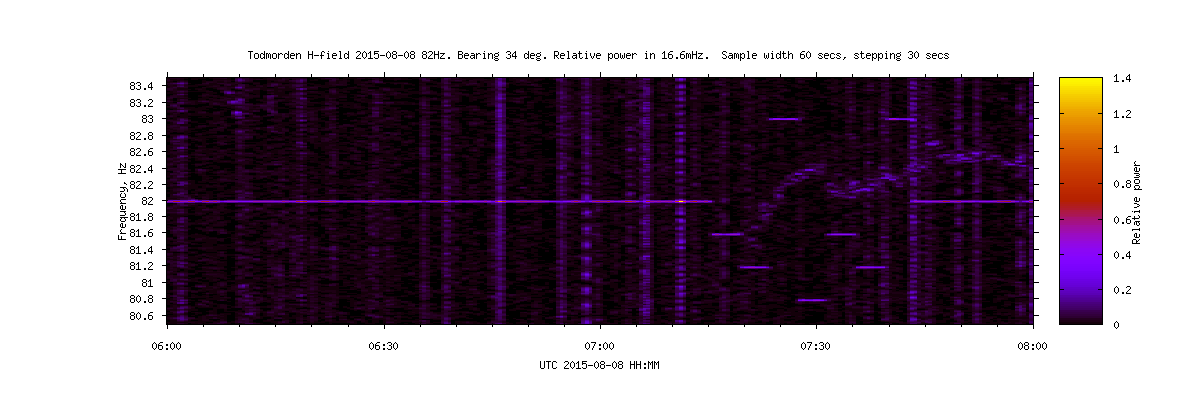
Spectrogram, ZEVS 150808_zevs1.png;
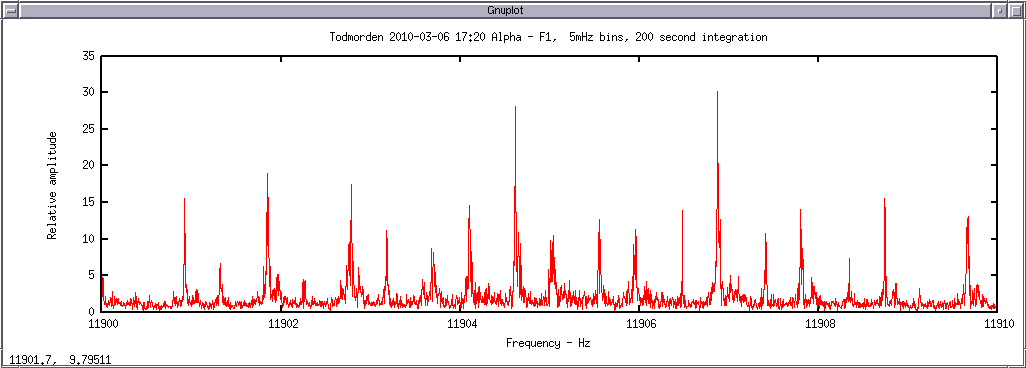
Spectrum, Alpha F1 at high resolution showing the sidebands alpha.100306b.png;
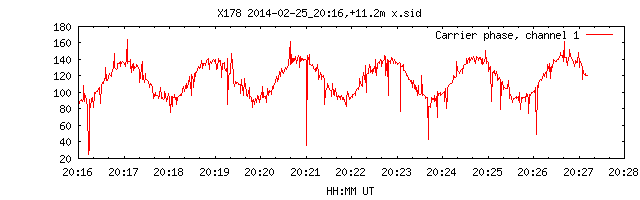
Phase plot, TACAMO aircraft, 17.8kHz showing 2 minute standard orbit x178.140225a.png;
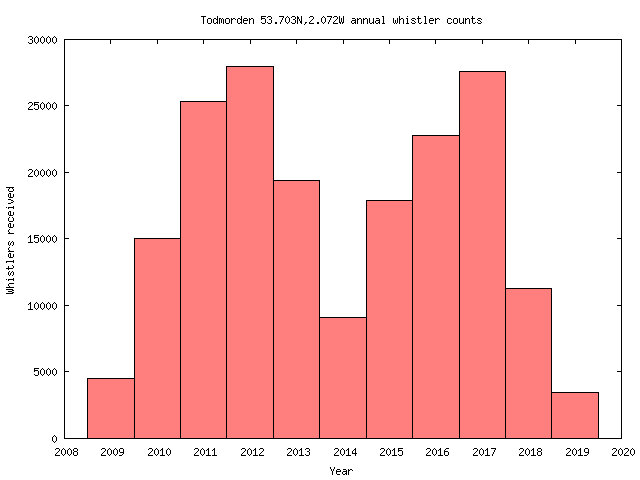
Histogram, annual whistler counts through one solar cycle 190509-vlf1.png;
Optimum PPS pulse width at 192k/sec on UMC404HD 191117a.png;
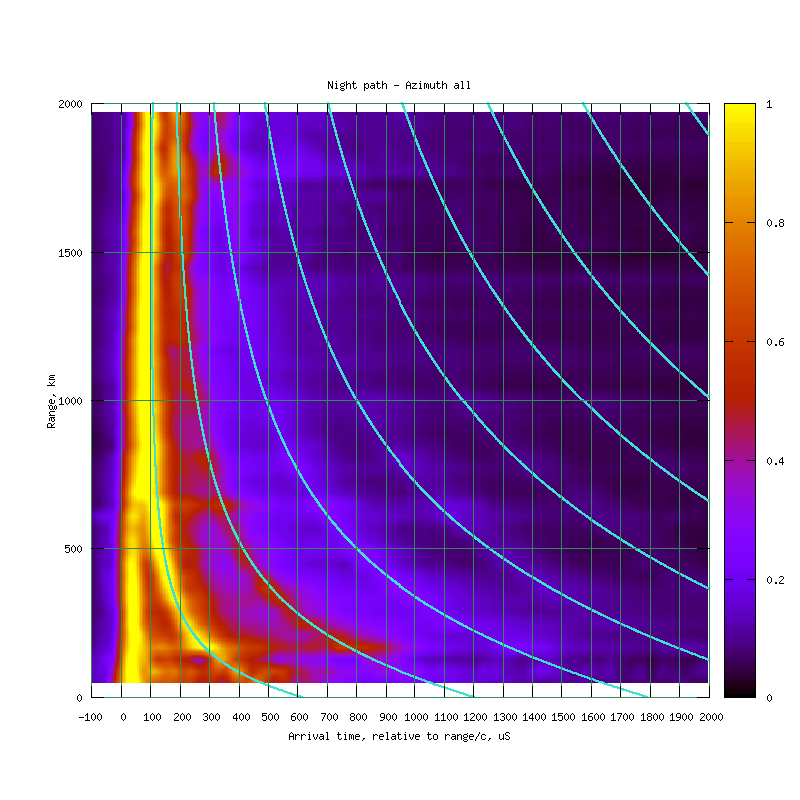
Intensity map, sferics as a function of distance, ground wave and successive sky wave arrivals, predicted sky waves overlaid
191207-n-all-h1.png;
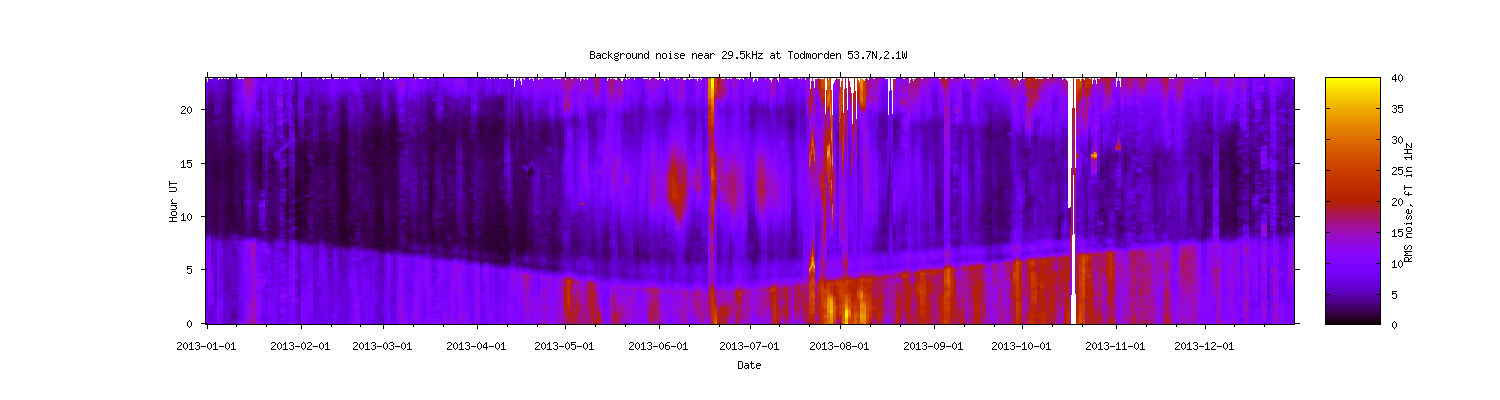
Intensity map, diurnal change of background noise at 29.5kHz, one year 29499_noise_2013.png;
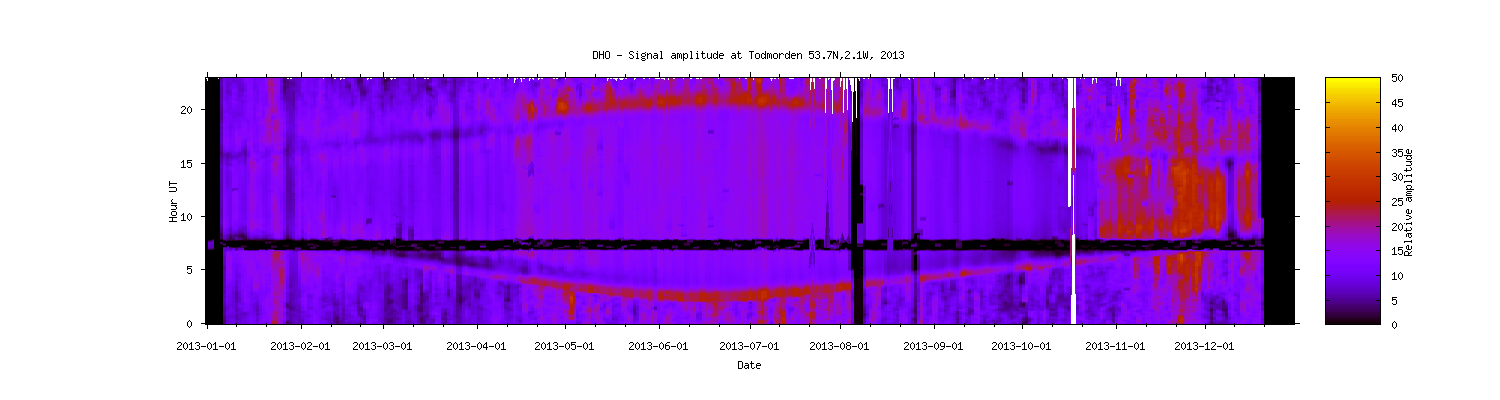
Intensity map, DHO diurnal, one year dho_2013a.png;
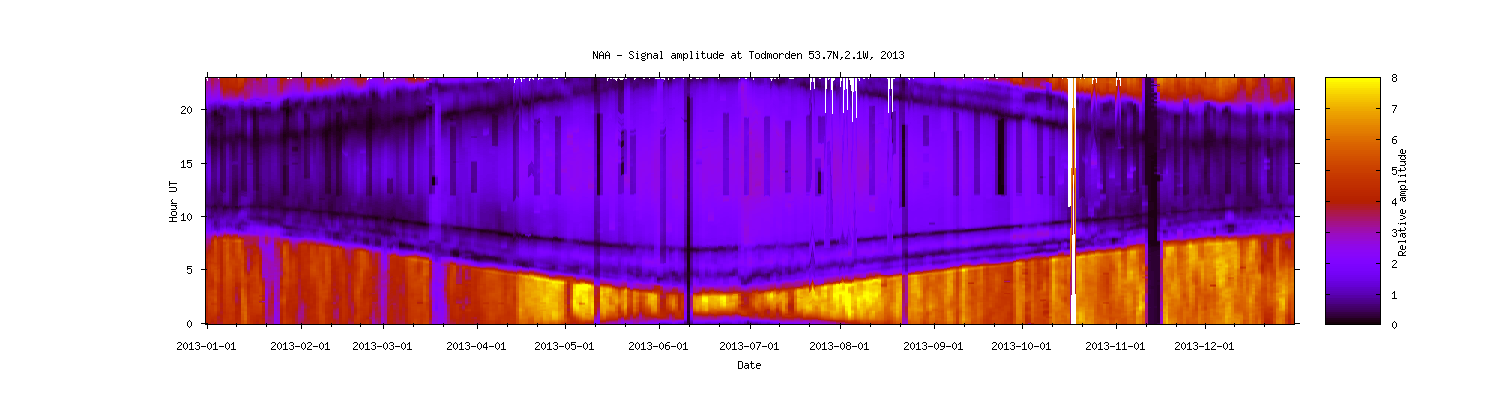
Intensity map, NAA diurnal, one year naa_2013a.png;
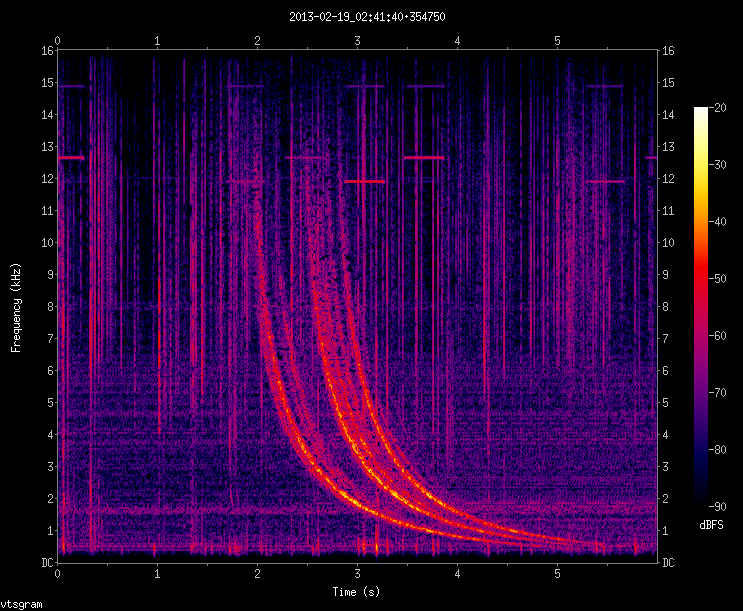
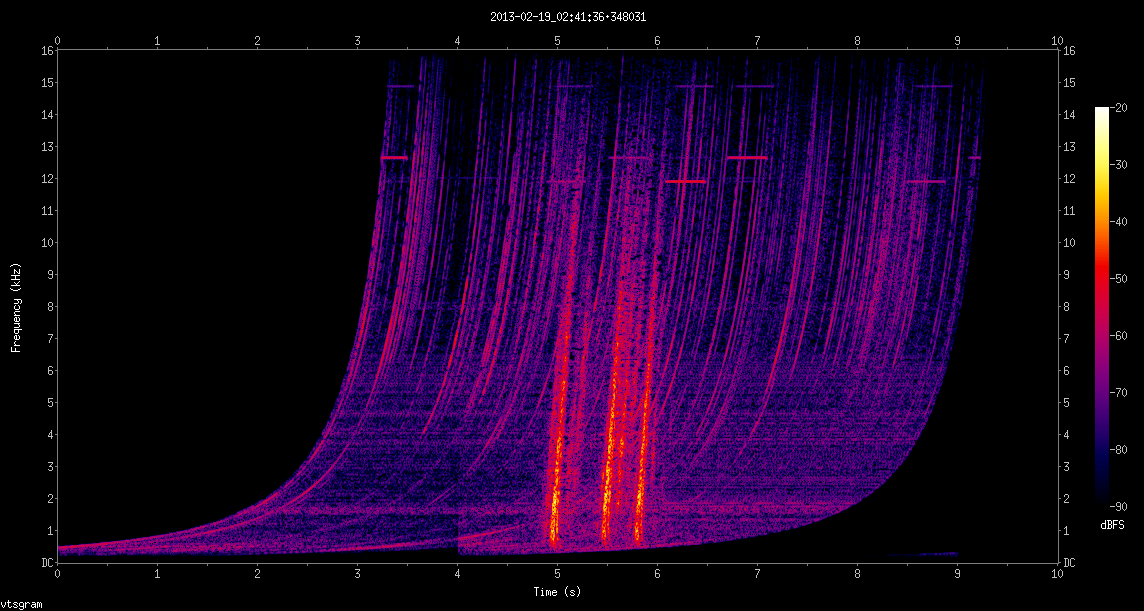
Whistler duct trilateration, de-dispersion of whistlers for timestamping,
original 130226a.png and de-dispersed 130226c.png;
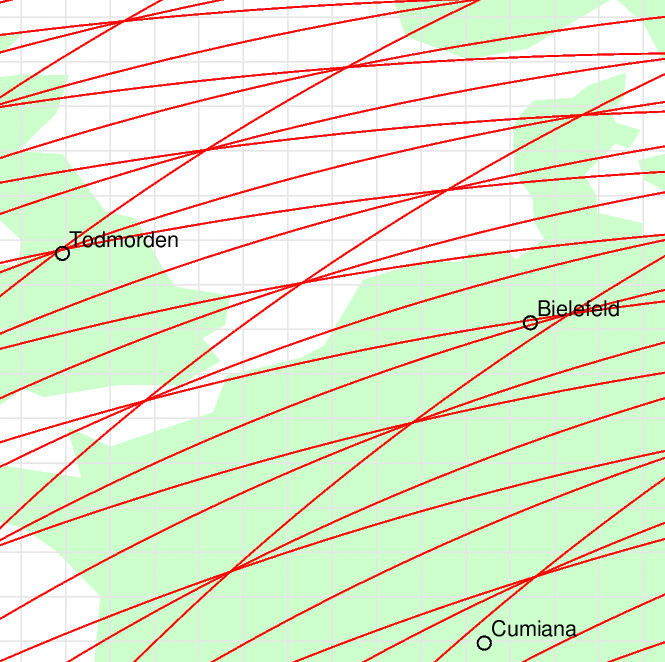
Using the Alpha hyperbolic navigation signals to locate Todmorden 131110b.png;
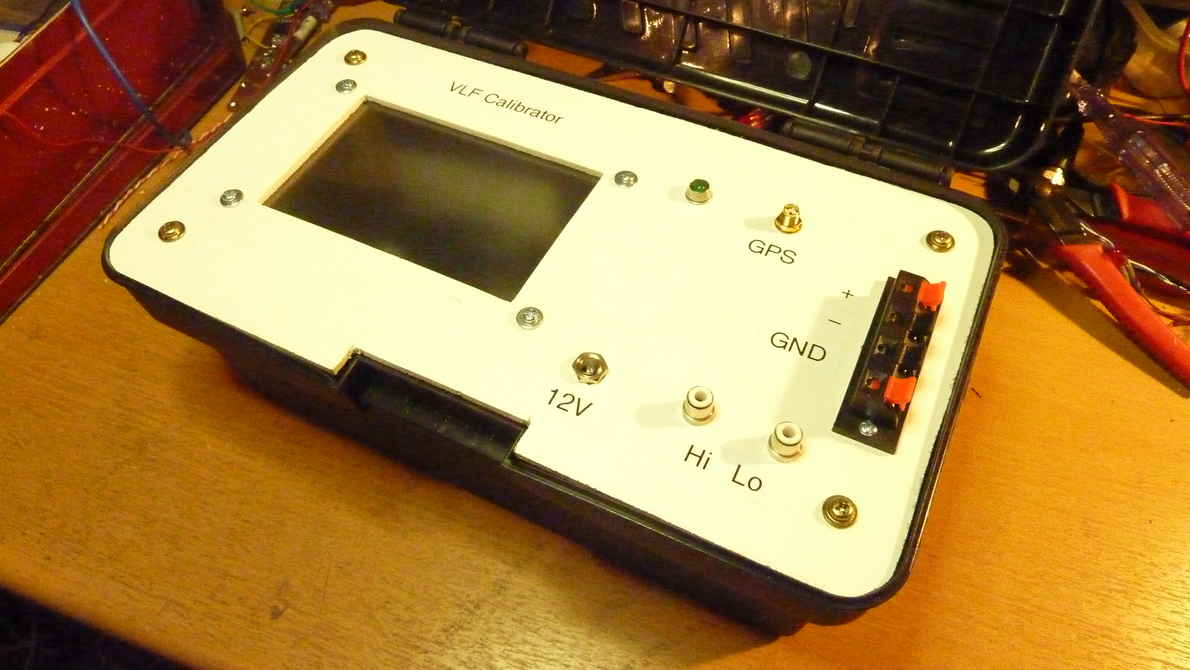
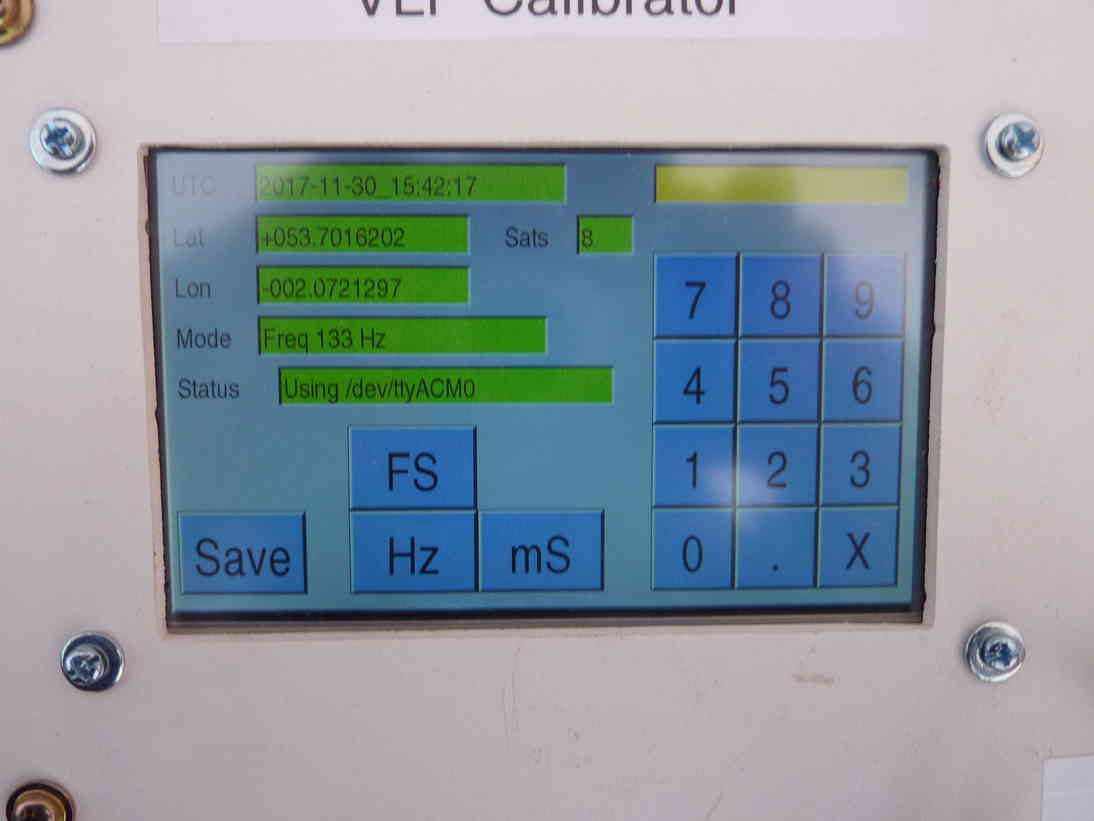
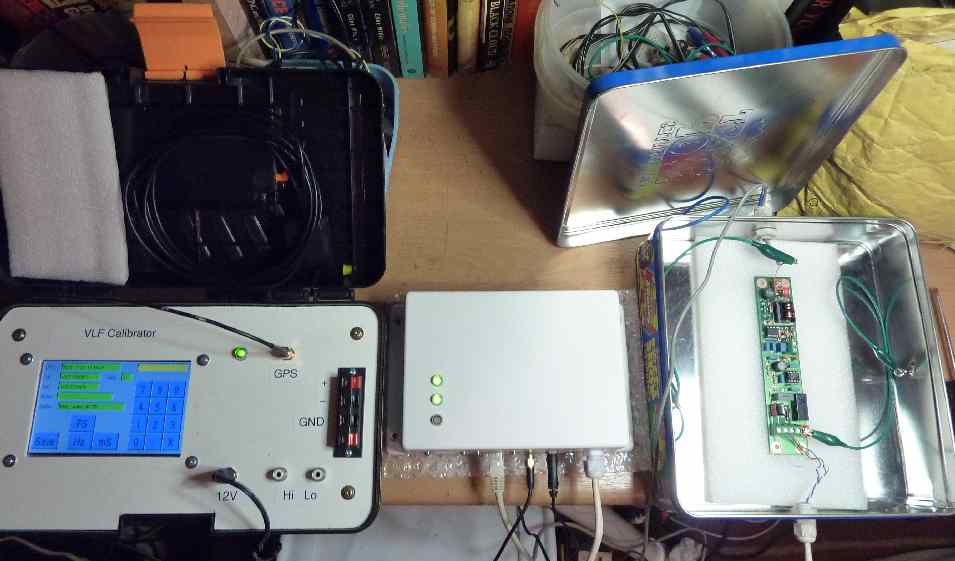
GPS based VLF calibration tool, u-blox 7 plus Raspberry Pi and touch screen
171123d.jpg, 171130c.jpg,
set up for phase and group delay calibration 171130f.jpg;
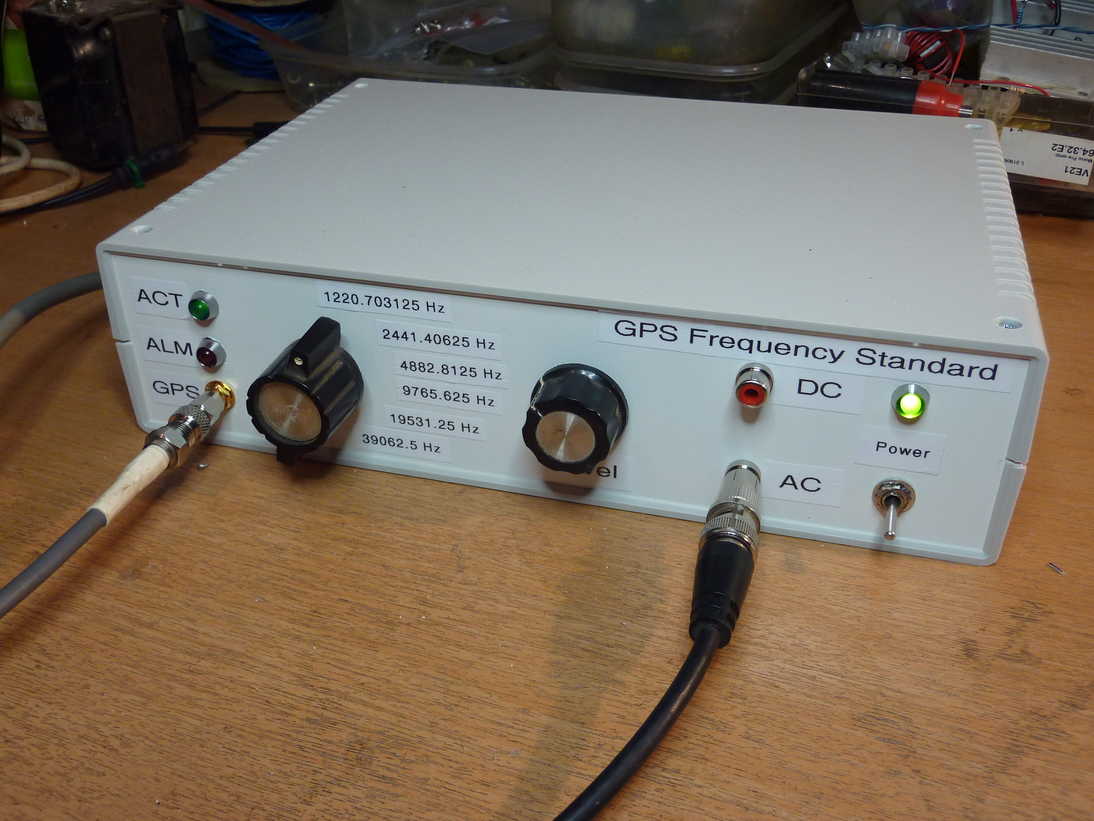
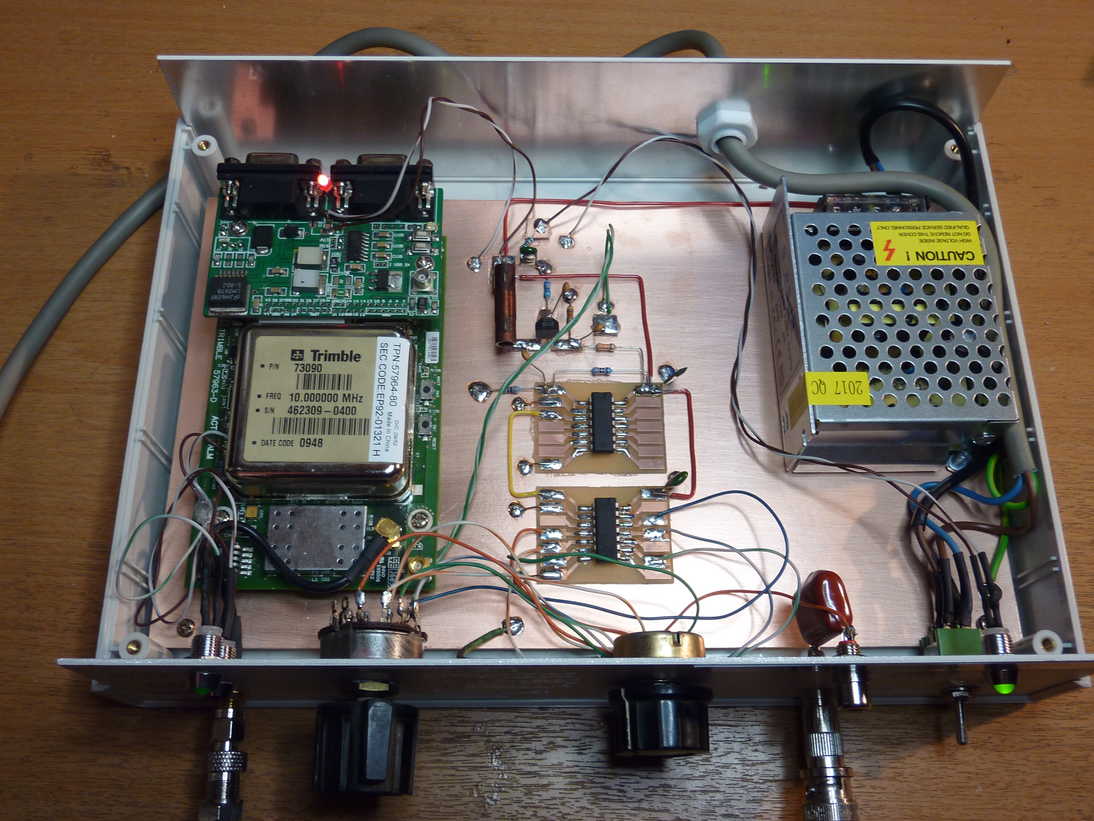
GPS frequency standard, Trimble 10MHz GPSD-OCXO plus divider
180121a.jpg,
180121b.jpg;
Testing prototype receiver for the
Indian Lightning Detection Network,
60cm tube, 40cm of which is antenna element, 20cm for pre-amp,
180924-487.jpg,
pre-amp test 181222-524.jpg;
A possible but unconfirmed VLF signal from a meteor
md130208a.gif;
Early development of automatic whistler detector,
VLF spectrogram top, Hough transform lower left, center was the whistler reconstructed from the Hough transform peak,
vsa090313.vlf3c.gif;
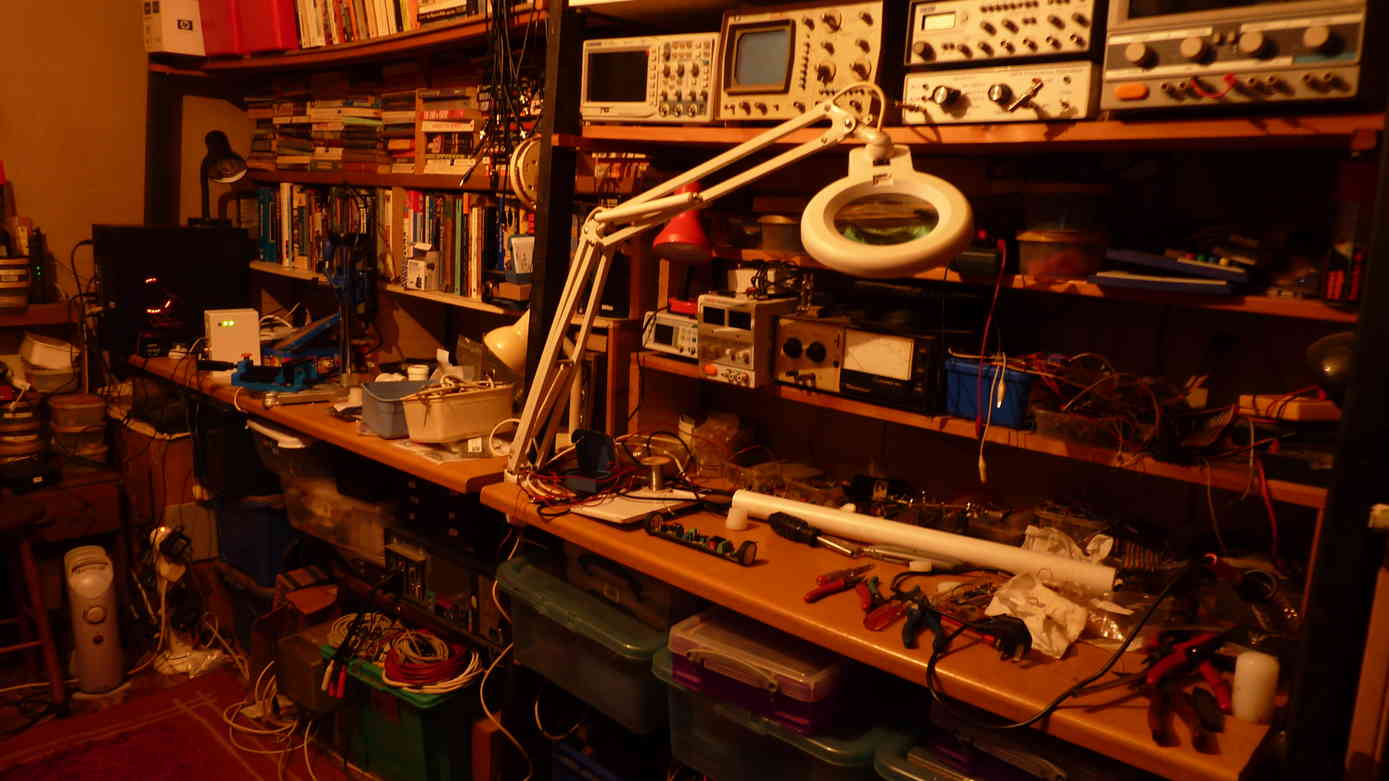
My office 181221.jpg;