This project involves quite a bit of software - several programs and data
files. This page provides a summary map and an overview of the components.
Updated: 19 Jul 2008
The software comes as a toolkit of programs which work together through
a number of internal data files. The internal data files are plain
ASCII, space separated fields, newline separated records, so that
they are immediately suited for use with countless hundreds of unix
toolkit programs. This provides an un-inhibiting framework for further
developments, and makes it easy to use parts of the toolkit with other
applications.
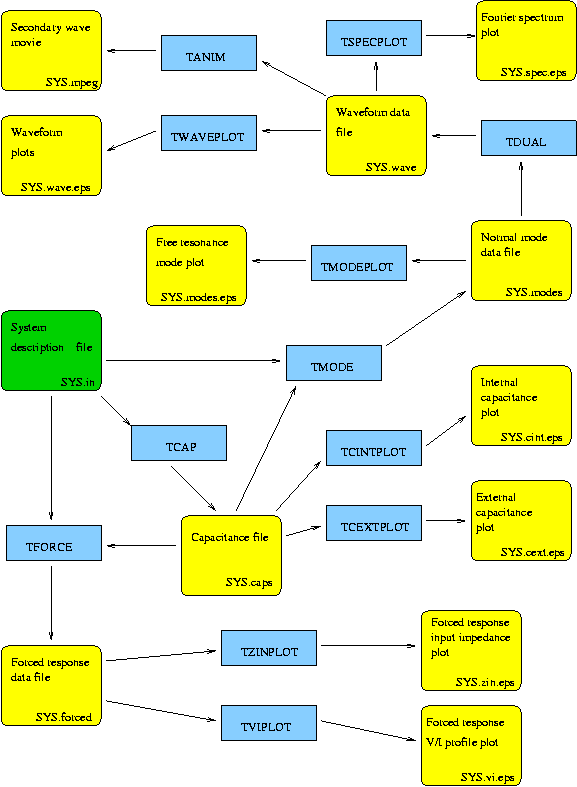
The diagram below shows the various components of the TSSP suite. Blue
boxes are programs, yellow boxes are data files, and the green box
highlights the system description file which the user must provide as
a starting point.

Data file names are shown with SYS in place of your system name. Output files are shown as EPS but can be
generated in any format of course. To get to the output file you want, start at the input file and follow the arrows.
For example, to generate a Fourier spectrum of a dual resonator Tesla coil, your must run TCAP to get a
capacitance file, then TMODE to generate a modes file, then TDUAL to compute the time domain
response of the dual resonator, and finally TSPECPLOT to generate the desired plot file. Very brief descriptions of
each of the components follow in the next section. Against each of the programs is a typical running time, which you can
add up to obtain the total runtime to reach a given output file, and against each of the data files is a typical filesize, which
you can add up to see if sufficient space is available.
SYS.in
The input file. A structured text file containing a description of
the resonator (2Kb). See Details and Example
TCAP
Calculates the distributed capacitance matrix, which is stored in the
capacitance file (5 mins).
SYS.caps
An internal data file containing the complete distributed capacitance
matrix (600Kb).
TMODE
Compute the normal mode spectrum of the resonator, and generate the
modes file (40 mins).
SYS.modes
An internal data file which holds a description of each normal mode
eigenfunction, along with
its complex frequency (200Kb).
TMODEPLOT
Generates a chart showing the available normal modes.
Example.
TDUAL
Computes the time domain response of a dual resonator Tesla coil, making
use of the available modes from the modes file (30 secs).
SYS.wave
A waveform data file, showing the instantaneous voltages and
currents everywhere in the resonator, as a function of time (6Mb). Format.
TWAVEPLOT
Takes the waveform data file and produces a chart of the major voltages and
currents (5 secs). Example.
TSPECPLOT
Generates a continuous Fourier spectrum from the contents of the
SYS.wave file (5 secs).
TANIM
Creates an animation sequence from the contents of the waveform file (20 mins).
Example.
TCINTPLOT
Makes use of the data in the capacitance file to produce a chart of the
internal capacitance distribution (5 secs).
TCEXTPLOT
Produces a chart showing the distribution of external capacitance (5 secs).
SYS.forced
An internal data file containing the steady state forced response of the
system (2Mb).
TFORCE
Generates the forced response data file for a range of sinusoidal forcing
functions (30 mins).
TZINPLOT
Produces a chart of the input impedance response for the resonator, using
the information in the forced response data file (5 secs).
TVIPLOT
Charts the voltage and current distributions along the secondary, for a
given steady state drive frequency (5 secs).
Maintainer Paul Nicholson, tssp1611@abelian.org.
