There is enough capacity on the Pi to monitor a small number of signals for sudden ionospheric disturbances. Monitoring for SIDs involves continually measuring and logging the amplitude and phase of some suitable signals, using the program vtsid.
You must first create a configuration file which tells vtsid which signals to monitor and how. Use your editor to create a file /root/sid.conf, containing the following:
; General settings
datadir /d/sid
bins 8192
monitor_interval 5
phase
channel efield cal=1.0

; Monitors
monitor GBZ msk,f=19580,br=100         ; England
monitor GQD msk,f=22100,br=50          ; England
monitor DHO msk,f=23400.0000634,br=100 ; Germany
monitor NAA msk,f=24000,br=100         ; USA
monitor NRK msk,f=37500,br=100         ; Iceland
monitor NSY msk,f=45900,br=100         ; Italy
The monitor interval of 5 seconds is a reasonable choice. The amplitude and phase of each signal is averaged for 5 seconds and then logged into data files under /d/sid.
Not all MSK stations are suitable for SID monitoring. Some will be too weak, others don't have a stable frequency, and some don't transmit continuously enough to be worthwhile using.
Save the configuration file and create a data directory with
mkdir /d/sid
Now set vtsid to work on channel 1 of the timestamped signal.
vtsid -c /root/sid.conf @timed:1
Then you should find some files appearing under /d/sid. From another shell,
ls -l /d/sid/mon
will show a sub-directory for each signal monitored. Within each, there will be one or more data files:
ls -l /d/sid/mon/DHO
The program vtsidex is used to read these files. Follow in real time the measurements being logged on a particular monitor, for example
vtsidex -t -m DHO /d/sid
This should output a line roughly every 5 seconds with three columns: timestamp, amplitude, and phase. For example
2018-02-16_20:46:23.9359 3.745e-03 117.40
2018-02-16_20:46:28.8852 3.729e-03 117.29
2018-02-16_20:46:33.8346 3.758e-03 117.07
2018-02-16_20:46:38.7839 3.731e-03 117.37
2018-02-16_20:46:43.7332 3.728e-03 117.54
2018-02-16_20:46:48.6826 3.715e-03 117.67
2018-02-16_20:46:53.6319 3.704e-03 117.66
2018-02-16_20:46:58.5812 3.681e-03 117.79
2018-02-16_20:47:03.5306 3.676e-03 117.86
2018-02-16_20:47:08.4799 3.681e-03 118.25
2018-02-16_20:47:13.4292 3.699e-03 118.43
2018-02-16_20:47:18.3785 3.707e-03 118.74
Run vtsidex without arguments to see the options available for extracting historical monitor data.
You can divert the output of vtsidex into a file for your favourite plotting program. For quick charts you can use vtsidplot, for example
vtsidplot -m DHO -Ttoday, /d/sid
which will plot everything so far today for the DHO signal. Press 'q' in the display window to close it. Use the -T command to plot or list historical data, for example
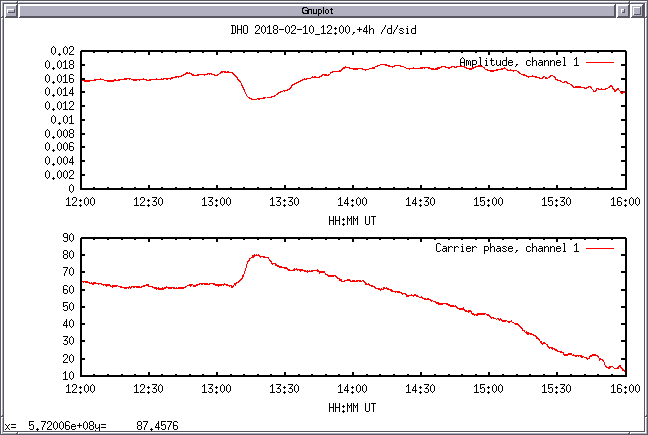
vtsidplot -m DHO -h5000 -T 2018-02-10_12:00,+4h /d/sid
produces

This particular example captures a typical SID produced by a small solar flare.
Running vtps should give you something like
  PID RT %CPU %MEM COMMAND
26766 99  5.4  2.0 vtcard -B -d hw:0,0 -r96000 -b32 -c2 -g-1 -L /run/vtcard.log
27072  - 27.0  4.9 vttime -B -m pulse+ -c2 -h 30 -L /tmp/vttime.log
27141  - 16.2  2.8 vtfilter -B -a th=5 @timed:1 @filtered
27149  - 11.5  0.9 vtresample -B -r32000 @filtered:1
27151  -  4.6  0.4 vtvorbis -B -ep -q0.4 -ktu shout,localhost,8000,/vlf,XXXXX
27156  -  0.1  0.1 vtwrite -B -G 3600 /d/vlf
27159  - 11.2  0.9 vtresample -B -r32000 @filtered:1 -- -,f4
27161  - 11.5  0.9 vtresample -B -r32000 @filtered:1
27163  -  6.3  1.3 vtevent -B -d /d/events
29815  - 33.5  1.8 vtsid -c /root/sid.conf @timed:1
vtsid uses about 33% of a CPU, and you can afford to monitor some more signals if you have any. vtsid is only single-threaded so don't load it up with so many signals that it exceeds 100% of a CPU - it will not be able to keep up with the live signal in @timed.
It just remains to add the vtsid command into your start-up script. Edit /root/radio and add the highlighted commands
#!/bin/bash

killall -q vtcard
killall -q vttime
killall -q vtfilter
killall -q vtresample
killall -q vtvorbis
killall -q vtwrite
killall -q vtevent
killall -q vtsid

if [ "$1" = start -o "$1" = restart ]
then

   sleep 2 # Delay needed when using Octo, the driver is slow to initialise

   vtcard -B -d hw:0,0 -r96000 -b32 -c2 -g-1 -L /run/vtcard.log -v @raw
   vtwait -t @raw

   vttime -B -m pulse+ -c2 -h 30 -L /tmp/vttime.log -v @raw @timed
   vtwait -t @timed

   vtfilter -B -a th=5 @timed:1 @filtered
   vtwait -t @filtered

   vtresample -B -r32000 @filtered:1 |
      vtvorbis -B -ep -q0.4 -ktu shout,localhost,8000,/vlf,XXXXX

   if [ -d /d/vlf ]
   then
      vtresample -B -r32000 @filtered:1 -- -,f4 | vtwrite -B -G 3600 /d/vlf
   fi

   if [ -d /d/events ]
   then
      vtresample -B -r32000 @filtered:1 | vtevent -B -d /d/events
   fi

   if [ -d /d/sid ]
   then
      vtsid -B -c /root/sid.conf @timed:1
   fi

fi
Save the changes, stop the manually run vtsid, and restart the radio system with
systemctl restart radio.service
and after it restarts, check that the SID monitor is running, with say
vtsidex -m DHO -t /d/sid
The SID monitor will now run until either the Pi loses power or the /d memory stick is worn out. Eventually you'll need to clear down the oldest files or you will run out of space. Decided how many days you want to keep and clear down with the command, for a 90 day cleardown,
find /d/sid -type f -mtime +90 -exec rm {} \;
Just add that command to your script /root/cleardown for an automatic cleardown.